Bear Market Rally or the start of a new Bull Market: what does the data say?
Analyzing the price movement can help answer an important question: are we in a bear rally or bull market resumption?
The saying “sell the fur before you hunt the bear” dates back to the 18th century and, as you may have guessed, the fur trader profession. The idea that it was possible to trade fur futures contracts even before the hunt was the starting point for the two dominant expressions in the market, the bear (bear market) and the bull (bull market).
Representing opposite signs thanks to animal attitudes, given that the bear attacks its prey with a kick from above, while the bull attacks from below, with a horn.
That the term “bear” market appeared before the “bull” market, therefore, is a curious fact, especially since it is still difficult to identify these periods, as you can see below:
By comparing the amplitude and duration of the last long bearish periods in Bitcoin, we can see how painful the current downward movement is.
Let's look at the odds to try to figure out if this is yet another bear rally or indeed the start of a big long-term bull market move.
As we saw above, both in terms of the duration and in terms of the magnitude of the decline, the current bear market has been somewhat “mild” compared to both the 2014 and 2018 bear markets.
Is this the “quietest” bear Bitcoin has ever faced or just a relief?
Bear market rallies are periods of price correction within a long-term downtrend. They are commonly known as rallies due to their strong appreciation in a short period.
Below we see the bear market of 2014.
With short/medium term bullish moves of up to 83%, enough to believe the worst is over.
We also saw the same type of movement taking place during the 2018 bear market, with a recovery of over 65%.
These movements are created by local sales exhaustion.
Due to the strong pessimism and long period of spot orders selling bitcoins to the market, the price ends up finding local exhaustion points and buying activity rekindles momentum.
So they are easily confused with the start of a new long period of bullishness.
In the traditional market these movements are not unknown, occasionally in bearish periods recovery movements are found
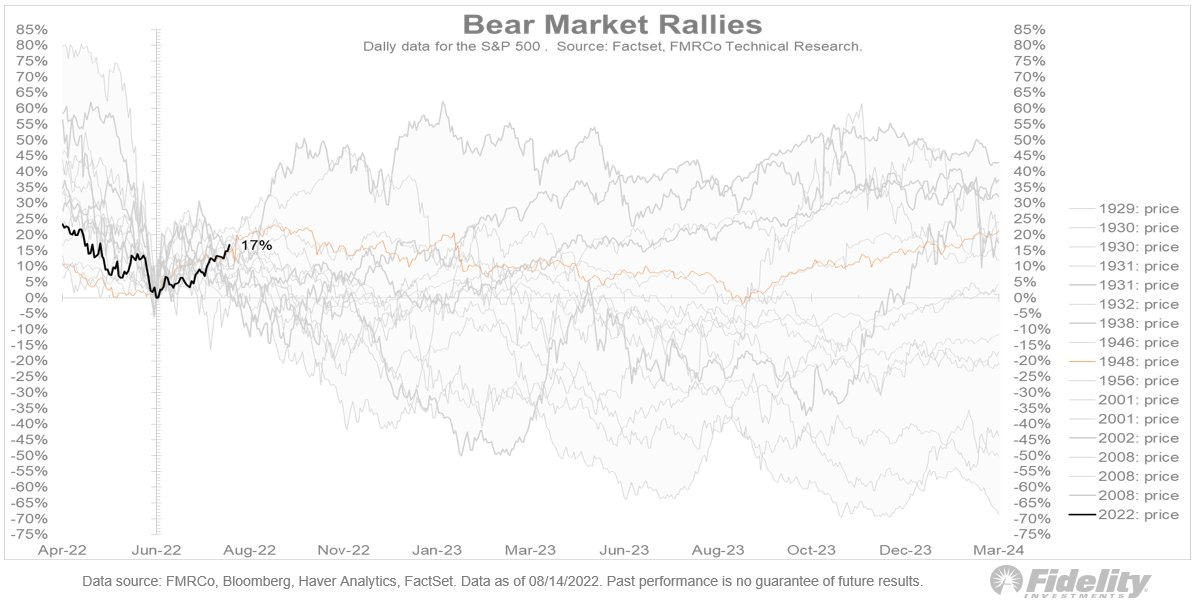
In fact, the current movement there is very regular compared to other bear rallies, which are on average 23% up, see below:
If the current bullish move is indeed a bear rally, which we cannot prove with complete certainty as we only make statistical projections, then we can visualize where the trading range of duration/amplitude similar to previous bottoms would be.
Here we visualize that, if the current movement is repeated, we will find the region of maximum pressure at the end of the year, starting in October.
Within a trading range between $10,000 – $14,500. But does that mean this is what will happen? No, we don't have a crystal ball.
This is just an observation through comparison based on previous moves, however we know that past moves do not guarantee future moves but give a good view of the probability field that we can analyze.
There are several macro factors, which include a strong economic recovery with a possible change in monetary policy and new fiscal/monetary stimuli that could positively influence prices in the next 3-6 months.
However, this is not my base scenario!
Do not take this analysis as an investment recommendation. Use it only to visualize the possibility of this scenario unfolding and perhaps this will help your decision making.
This research analysis was originally published here on BlockTrends. Graphics and study developed by Cauê Oliveira.


