Miners are facing the most pressure in their history, having the lowest reward per hash force applied ever recorded.🚨
Let's understand what is causing all this stress in the industry and what the consequences are for the price of BTC
The chart below is constructed from total mining revenue (Block Reward + Embedding Fees) divided by current compute strength in ExaHash/sec.
This gives us a view on daily profitability compared to how much Hashrate it takes to get it.
At this moment hashprice, as the indicator is known, reached $66,500 which is the lowest value ever recorded.
Total revenue has strongly deviated from its average annual growth.
What is common in all bears but with one difference: the costs of maintaining the operation
Bitcoin and asset prices in general are falling, however, on the other hand we have electricity prices in European regions, as we see in the chart below through the global price of natural gas in the European Union.
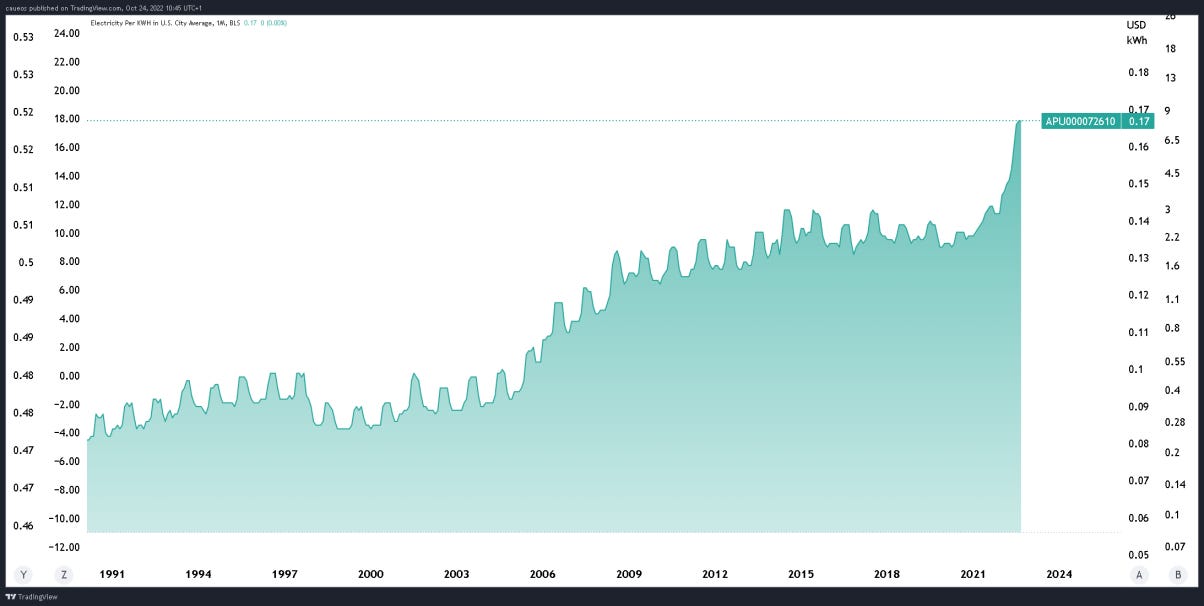
Not only in the EU, but in the US, where most mining rigs are currently concentrated, also see electricity prices per KWh going to highs as well.
With higher production costs and difficult access to debt financing due to constant interest rate hikes, many mining companies have turned to equity financing.
In order to sell shareholding shares in exchange for capital for opex.
This is the kind of access to capital that 5 or 6 years ago was very unlikely to be possible.
Mining was still poorly understood and companies had little support in the face of traditional capital.
The scenario is different today, with more than 15 companies listed on the stock exchange.
With less efficient miners needing to scale back or close operations to reduce cost, this has brought a high supply of mining rigs to the market. Making ASICs prices close to historic lows, both old and new generations.
This offer may be absorbed by participants who intend to increase their operational capacity in places with lower energy costs.
Many countries such as Africa have the lowest electricity costs and can become important hubs.
The purchase of these rigs, the search for lower cost regions and even idleness of ETH miners who may have migrated part of their structure to Bitcoin may be resulting in the current historical highs of computational power and mining difficulty, as seen below.
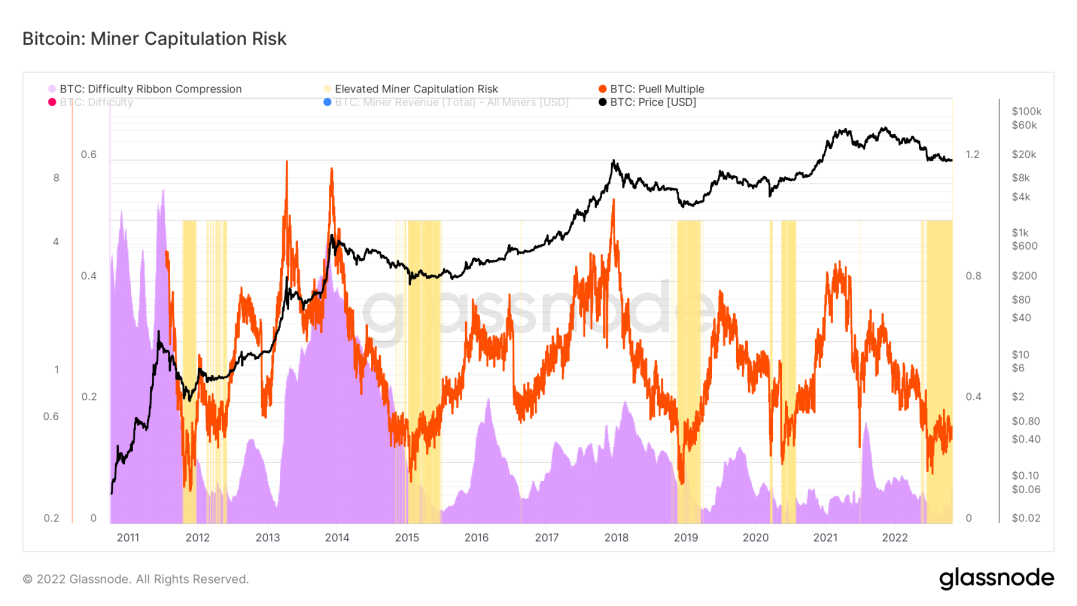
All these factors contribute to the still current capitulation of miners, which can be seen through the risk tracking dashboard below.
At this time, activity remains at high risk (Yellow) of capitulation, similar to previous bears.
This heightened risk could drive more selling to the spot BTC market to fund mining activity, which in turn could be an element of further pressure on the price.
Some indicators may indicate the level of expected capitulation and on what price basis based on issue and difficulty can be achieved.
One of the indicators I follow was developed by paulewaulpaul to calculate the cost of producing Bitcoin through the difficulty and issuance of BTC. I even brought this indicator here
At the moment we have the 3 model prices as follows:
PoW Pricing Model = 12,100.79
Model 1.41x = 17,066.35
Model 2x = 24,207.59
In a possible capitulation of miners I would keep an eye on the floor model and the 1.41 of the model. Remembering that all previous bears have experienced a PoW PM approach test.


