Standard Deviations Multiple, a way to visualize cycles based on price action.
Finding moments of over/undervaluation through the degree of cumulative variability of Bitcoin's historical price.
Introduction
Many indicators of cycles in Bitcoin have been published over the last few years, many researchers, traders and analysts have already developed great tools to guide cycles and to these brilliant minds I want to thank you, as these studies allowed me to evolve to the point of starting to develop my own indicators.
This is the first indicator that I have published, and it was made completely from scratch and exclusively with statistical reasoning of the cumulative action of the Bitcoin price.
Why use standard deviation?
When we refer to the standard deviation in a dataset, we are referring to a statistical parameter whose purpose is to measure the degree of variability in a dataset. That is, it is a coefficient of variation of these data.
By using the historical price dataset, we are therefore measuring the degree of price variability according to its fundamental trend, that is, the positive or negative variation of the underlying trend of bitcoin adoption and growth.
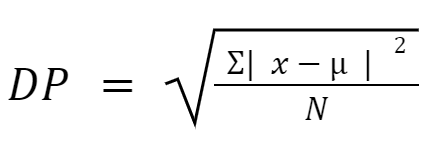
The standard deviation formula below shows the relationship between the mean of the data set and how much variation is obtained across the total set.
In this way, we can understand the moments where the price of Bitcoin deviates from its cumulative average, that is, the historical average of the price since the beginning of the observation.
When we apply the cumulative standard deviation (from the beginning to today) we get the green line in the graph above, which was the starting point of the study.
By using only the standard deviation we are not able to get as much signal as would be expected, so you will need to apply multiples to the standard deviation to find points of interest where the price has related to these multiples.
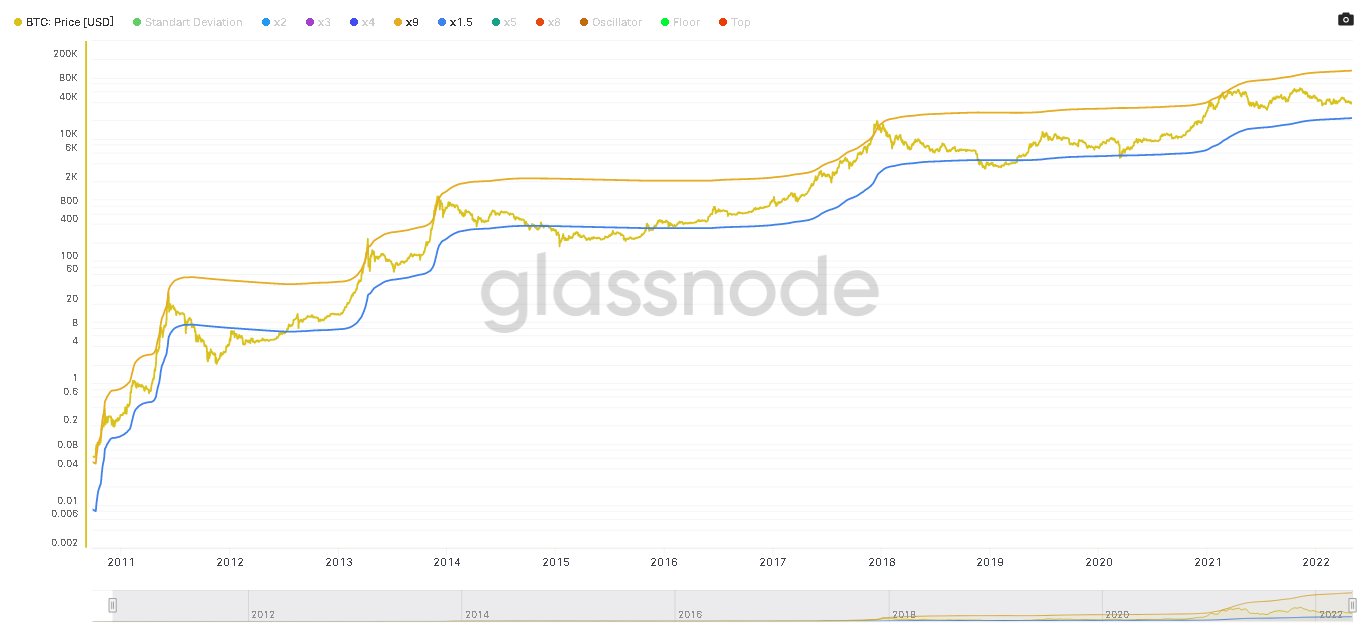
Therefore, to add the observation of different multiples I performed several tests that can be seen below. Multiples of 1.5, 2, 3, 4, 8 and 9 were used to create standard deviation bands.
The next step was to find which of these standard deviation variations are more accurate in highs and lows price regions of interest. The multiples found that best fit were 1.5 and 9, you can see below how they are positioned exactly according to the cycles, especially in bear market funds.
Now we need a way to extract the moments where the price deviates below or above these two multiples, for this the relationship between price/standard deviation was used, the result seen below is an oscillator that moves according to the price.
Now with the oscillator it is easier to visualize the moments when the price goes further from its standard deviation, usually cycle tops and the moments where it is closer, historically at cycle bottoms.
The last step was to use just the two multiples of the standard deviation that I mentioned earlier to delineate the points of interest of tops and bottoms, for this a horizontal line was used at the exact 1.5 and 9, the result below is the formatting of the complete indicator.
All moments where the oscillator crossed the red horizontal line corresponded to cycle tops, as well as all moments where the oscillator went below the green line corresponded to cycle bottoms. It is worth mentioning that the movement at the bottom takes a longer period than at the tops.
An “aggressive” DCA strategy in regions below the green line has historically yielded good upside potential and high profitability.
At the moment, through my indicator, we are in a downtrend that is going to look for the bottom zones of the multiple of 1.5, a region that indicated preferential entry zones in a long-term strategy.
This model has little complexity, but historically enough accuracy.
Conclusion
In this article I introduced the macro cycle model that I called the Standart Deviations Multiple, a statistical model based on multiples of the cumulative standard deviation of the price of bitcoin since its inception.
As my first authorial model, I would like to thank the entire bitcoin and on-chain community for the teachings and content already available.
Other studies are already under development for future publications.


