Bitcoin could be close to a strong movement
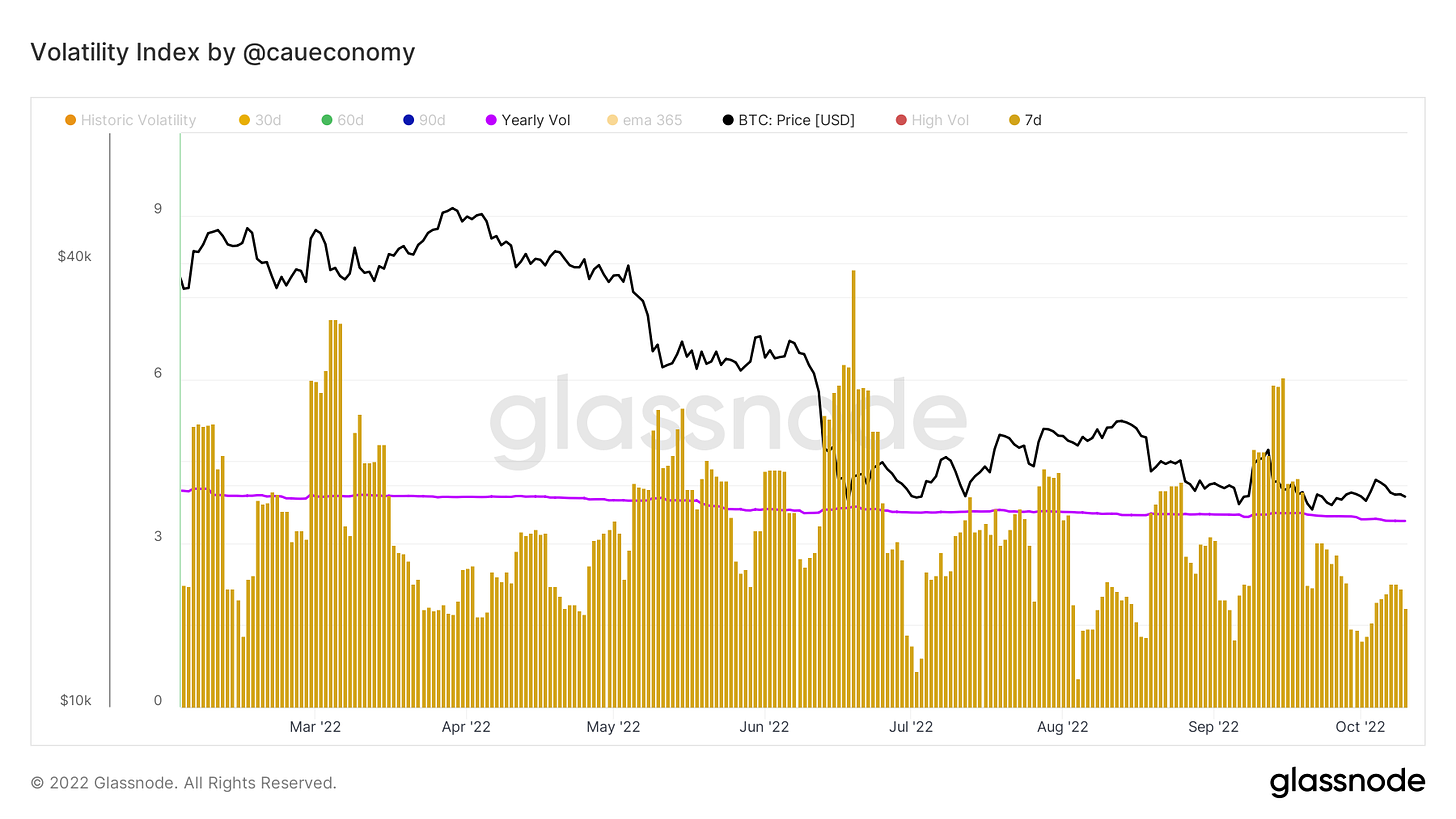
Falling historical volatility (7d) may indicate the approach of a new "leg" as current price ranges provide low interest, traders are eager for some change.
Periods of decreasing volatility often precede strong price moves as they reduce trades and make traders anxious.
The spring in price ends up bursting through strong short-term speculation around current values.
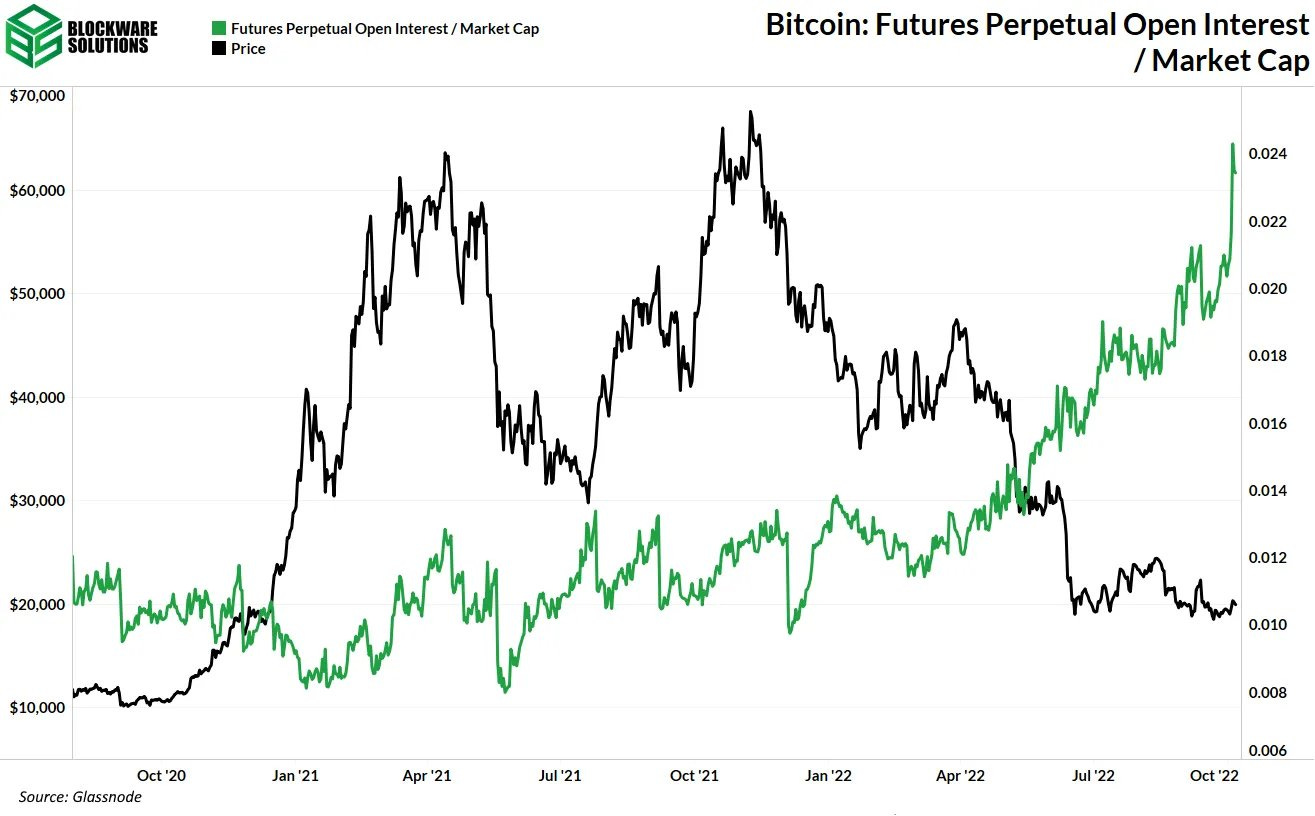
At the moment we see the amount of open contracts relative to market capitalization reaching new highs, traders are growing speculation around the next market move.
source: @BlockwareTeam
This makes the current price strongly guided by these short-term players, structure quite unstable and sensitive to macro changes.
Low spot demand can be seen on-chain and through trading data and volumes, proving the current situation.
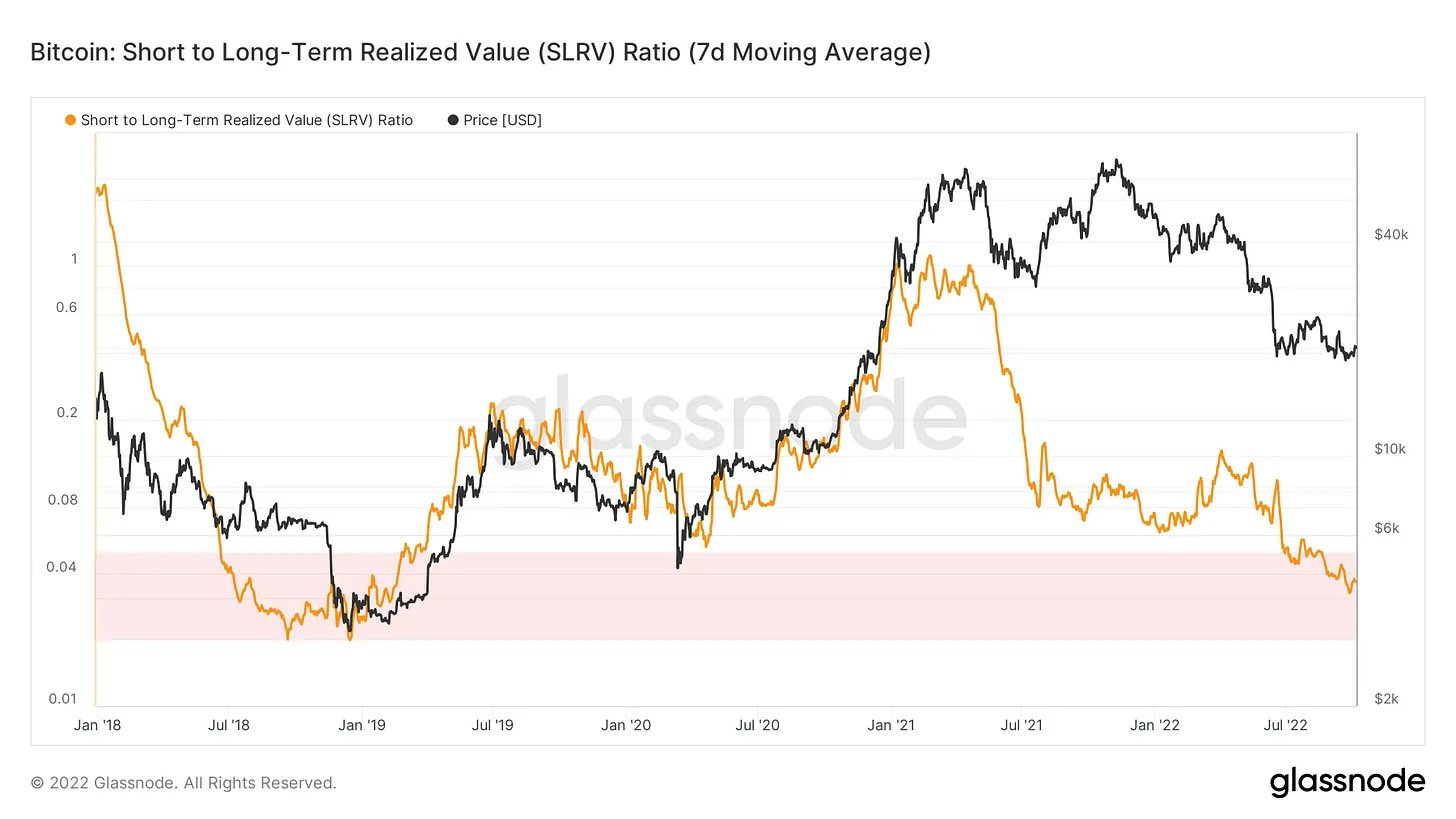
The realized value of short-term holders compared to the long-term ones evidences the "bearish sentiment" of traders, exposing the market structure to regions of historical undervaluation, but with low reversal strength for now.
This low conviction and spot activity can drive strong short-term moves within a high leverage market, but it will hardly be the structure that will maintain momentum.
Traders will be able to take advantage of impulses, but it will take discernment to carry out early.
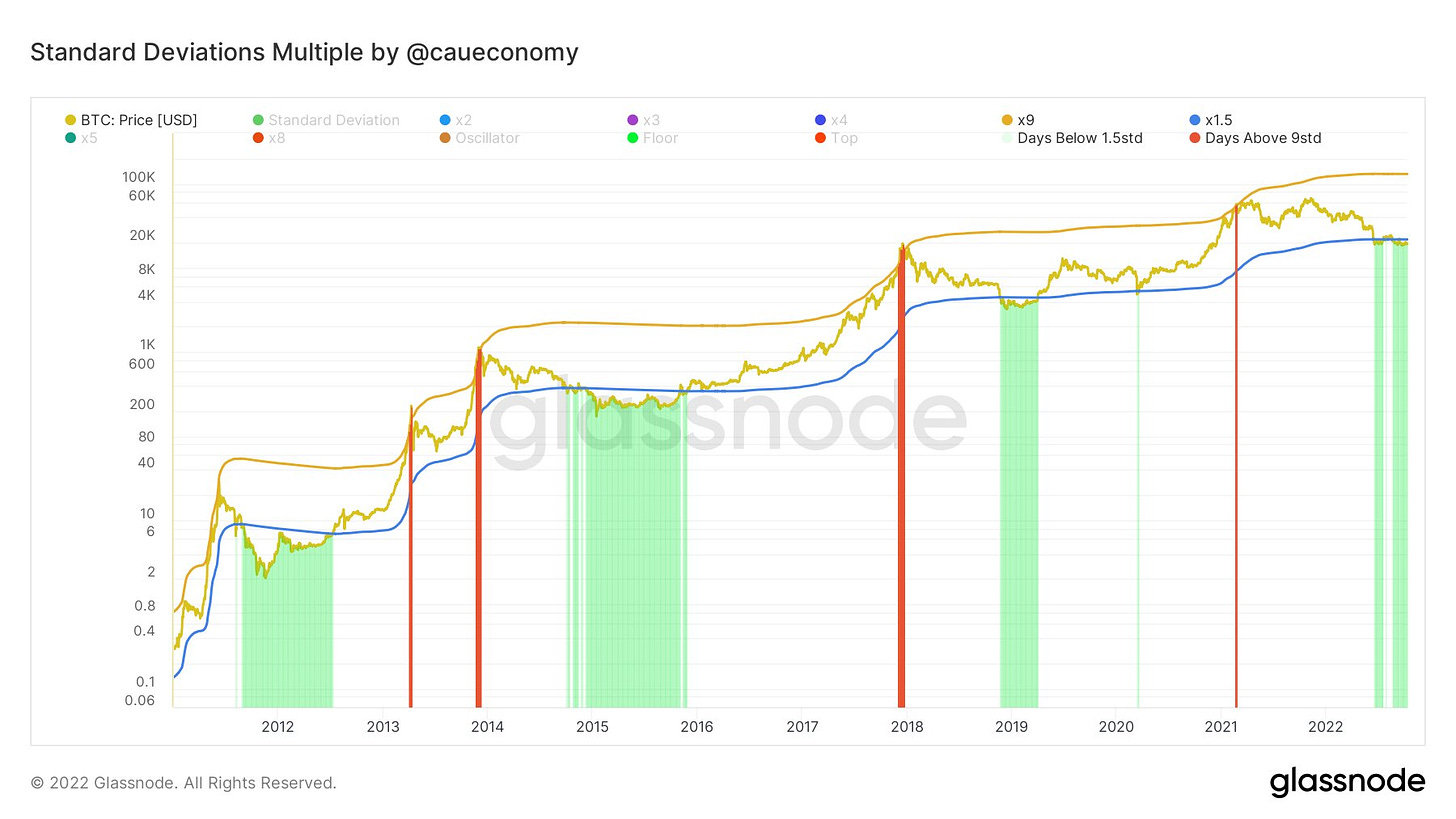
On the other hand, #BTC within long-term metrics presents a configuration of EXTREME undervaluation relative to market cycles.
Allocations here could have strong returns over longer time horizons, as we see through the SDM (You can check the article about this indicator here):
So we can understand that a short-term price explosion movement may be underway, with the possibility of another breathing rally.
However, should it occur, it is necessary to understand that there is little support structure and reversals can come quickly.
As was pointed out in August, there is still little evidence of spot demand and we will need to track a reversal in this trend.
Since the last Research piece about this, written here, BTC has dropped by more than 15% and increases were just price "traps".
Note: The Historical Volatility indicator presented above is part of my set of private indicators. It has not yet been publicly released nor its complete study with the visualization of past cycles.
Subscribe to my substack and follow me on twitter to know when it's released.


